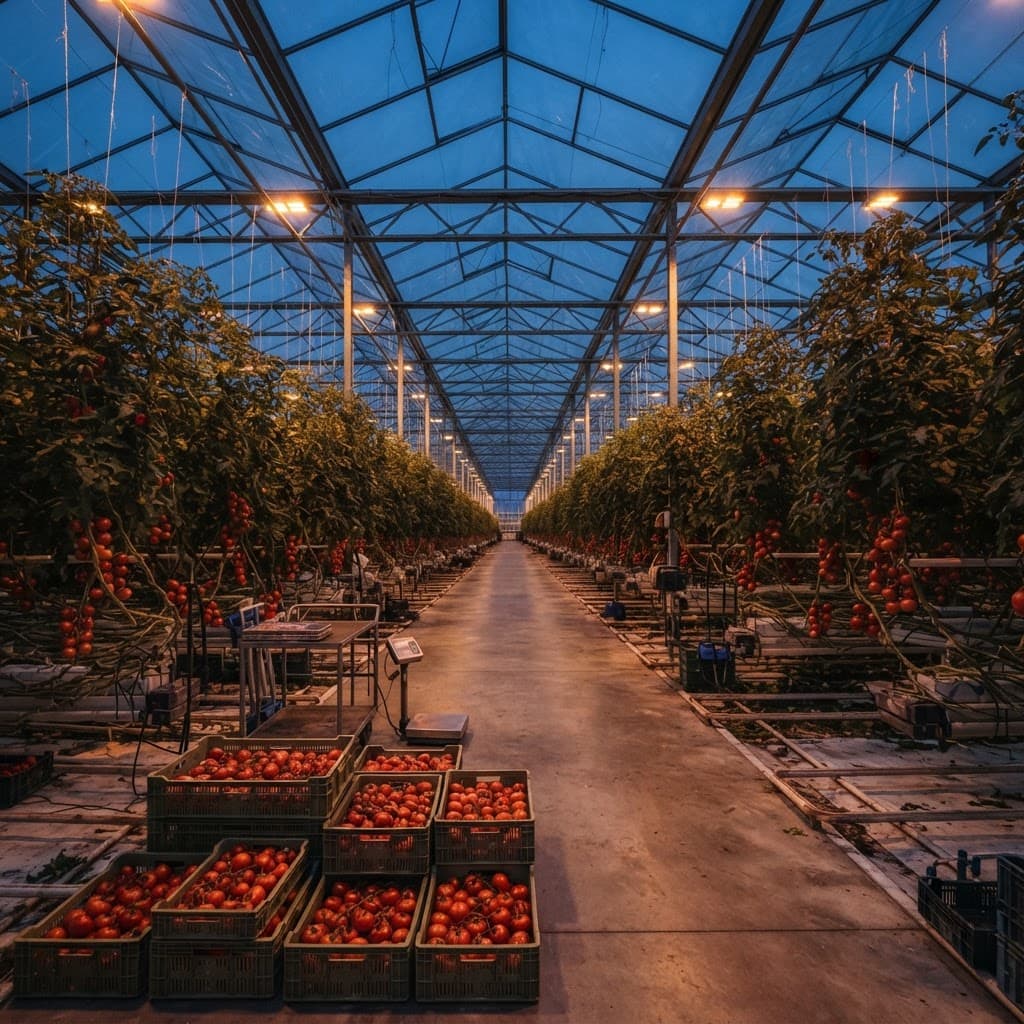
An honest assessment of greenhouse farming profitability: realistic payback periods, margin structure by crop, the operating costs that decide outcomes, and when projects do not work.
Well-executed commercial greenhouse projects typically return capital in four to eight years. Poorly executed ones do not return it at all. Protected cultivation raises yield per square metre several times over open field production, but it also converts a weather-dependent business into a capital and energy intensive one. The technology is not what determines the outcome.
What actually drives profitability
Across the projects we assess, four factors explain most of the variance between facilities using near-identical technology. None of them are engineering decisions.
Market access: a contracted buyer at a known price, or exposure to spot markets
Energy position: cost per unit and exposure to price volatility
Operational capability: whether an experienced grower runs the facility
Scale: fixed overhead spread across enough production area
Margin structure by crop
Different crops produce profit in different ways. High-wire vegetables generate volume at thin unit margins and are highly sensitive to energy cost. Berries carry higher unit prices and higher labour intensity. Leafy greens turn capital over fastest but compete closest to commodity pricing.
The operating costs that decide outcomes
Energy and labour together typically account for 55 to 75 percent of operating cost in a heated facility. Both are commonly underestimated at feasibility stage, and both are where the difference between a modelled and an actual return usually originates.
Energy: 25 – 45% of operating cost in heated climates
Labour: 20 – 35%, with sharp harvest peaks for berry crops
Planting material and substrate: 8 – 15%
Fertiliser, crop protection and CO₂: 6 – 12%
Packaging and logistics: 8 – 18% depending on market distance
Maintenance and replacement reserve: 3 – 6%
When greenhouse projects do not work
We advise against proceeding more often than clients expect. The recurring situations below are ones where the model rarely closes regardless of how well the facility is engineered.
No identified buyer beyond an assumed local market
Energy cost high with no screens or buffering in the budget
Scale below roughly two hectares carrying full overhead
No experienced grower contracted at the outset
Water quality requiring treatment that was never budgeted
Target market already saturated in the intended window
Reading a return projection critically
Treat any projection that presents a single scenario as marketing rather than analysis. A credible model shows sensitivity to energy price, yield shortfall and price realisation, and it accounts for the establishment period during which the facility consumes cash without producing at full rate.
What improves returns most reliably
In our experience the highest-return decisions are made before construction and cost comparatively little: correcting the water strategy, sizing the screen package properly, designing the layout around harvest labour, and contracting an experienced grower. Each of these tends to outperform incremental spending on structure specification.
Indicative return profile by crop, well-executed facility with market access
Crop
Capital intensity
Time to mature yield
Typical payback
Primary risk
Tomato (high-wire)
High
2nd cycle
5 – 8 years
Energy price exposure
Cucumber
High
1st – 2nd cycle
4 – 7 years
Price volatility
Strawberry (table-top)
Moderate
1st – 2nd season
4 – 6 years
Harvest labour supply
Blueberry (substrate)
Moderate
Year 3 – 5
6 – 9 years
Long establishment period
Lettuce / herbs
Moderate
1st cycle
4 – 6 years
Commodity price pressure
About the author
Aegis Investment Advisory
Feasibility and capital planning desk
The advisory desk builds the feasibility and capital models that Aegis clients present to boards and lenders. Work focuses on cost per square metre, energy cost per kilogram, phased capital deployment and the assumptions that determine whether a project is financeable.
Feasibility modelling
Capital planning
Energy economics
Risk assessment
FAQ
Frequently asked questions
What is a realistic payback period for a commercial greenhouse?
Four to eight years for a well-executed facility with contracted market access. Perennial berry projects run longer because the crop takes three to five years to reach mature yield. Projections below four years usually rest on optimistic price or yield assumptions.
What profit margin can a greenhouse achieve?
Mature, well-run facilities commonly operate at 15 to 30 percent EBITDA margins. Margins compress sharply with energy price spikes or when output is sold into spot markets rather than under contract.
Is greenhouse farming profitable at small scale?
Below roughly two hectares, fixed overhead — management, climate control, packing infrastructure — becomes difficult to carry per square metre. Small facilities can work in high-value niche markets with direct sales, but the economics differ fundamentally from commercial supply.
How much does energy price affect returns?
In heated climates it is usually the single largest swing factor. A facility with dual screens and heat buffering can operate at 25 to 40 percent lower energy cost per kilogram than the same structure without them, which is often the difference between viable and marginal.
Start Your Greenhouse Project With Aegis
Send us your location, available area and target crop. You will receive a structured first assessment with technology direction and an indicative investment range.